.NET code coverage with OpenCover and Bamboo
Posted on 2015-05-06
Code coverage is a neat metric to have on a project. It can give you a rough idea of how robust your code is.
Starting a brand new projects has a lot of perks. One of those is a green field for starting testing the proper way. Testing is hard, obviously. With a new project, you can apply TDD as much as possible. You can use the right tools for the job. You can make sure that the team stays on track.
You want to make sure that everyone agrees on the way to go and understands why. Everyone is on board with testing on the project, and it’s great to see unit, integration and systems tests (NUnit and Selenium, blog post to come) come along a pull request. But what’s a good way to measure test quality? It’s not an easy question to answer. I think the more data we can have, the better.
So I set out to integrate a code coverage tool into our automated build so we could have a decent trend over time of our coverage. It’s obviously not the only thing we will use to determine quality, but it’s a data point!
There are a lot of tools for getting code coverage. I usually try the open-source approach first because that’s just the way I like things! OpenCover was basically the only free one that is actively maintained. It seemed to have a lot of features, an active community, good tutorials and integration with a lot of tools.
I modified the unit tests step in our FAKE build to run the tests through OpenCover so coverage could be gathered while the tests run normally as part of the build process.
There really wasn’t that much magic to it. OpenCover watches every DLL loaded while the nunit-console.exe runs the tests and uses the filter to know if it should record
coverage for that file.
OpenCover on its own simply generates an XML report that isn’t very user friendly. But using ReportGenerator allows us to generate a great HTML report with percentage for each assembly, namespace, class, etc. We can even open each file and see which lines are not covered as well as which branches are not covered. In the latest version, it’s even possible to get a history / trend of coverage between each report. I have not looking into it yet.
Last step is generating NCover output from the OpenCover XML file so we can tell Bamboo to read it.
The XSL file is available in the OpenCover wiki. For Bamboo, we simply need to
open the build plan configuration, click on the job we run the OpenCover code in and select the “Miscellaneous” tab. There’s an option for NCover, we simply write down
the path of the folder where we generated the NCover output. The NCover file has to be in a directory.
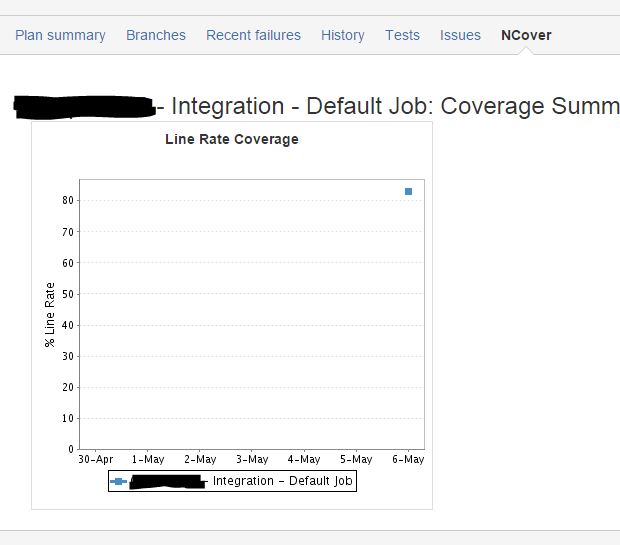
It’s possible to have multiple files in the directory, Bamboo will then create an average between all the files. The ReportGenerator output is also added as an Artifact of the build, so we can look at it and keep it in the build history. The Bamboo graph is fairly basic, but it’s enough to get a glance and dig in the artifact if necessary.
The XSL transform takes the line coverage data points from OpenCover’s output. It trivial to change it to use branch points. Simply replace SequencePoints/SequencePoint
to BranchPoints/BranchPoint in the XSL file.
So far the only small problem I’ve found is that the output Bamboo parses doesn’t have the same percentage as the OpenCover results. I’m guessing the XSL loses a bit
of data. I’ll look into it eventually.